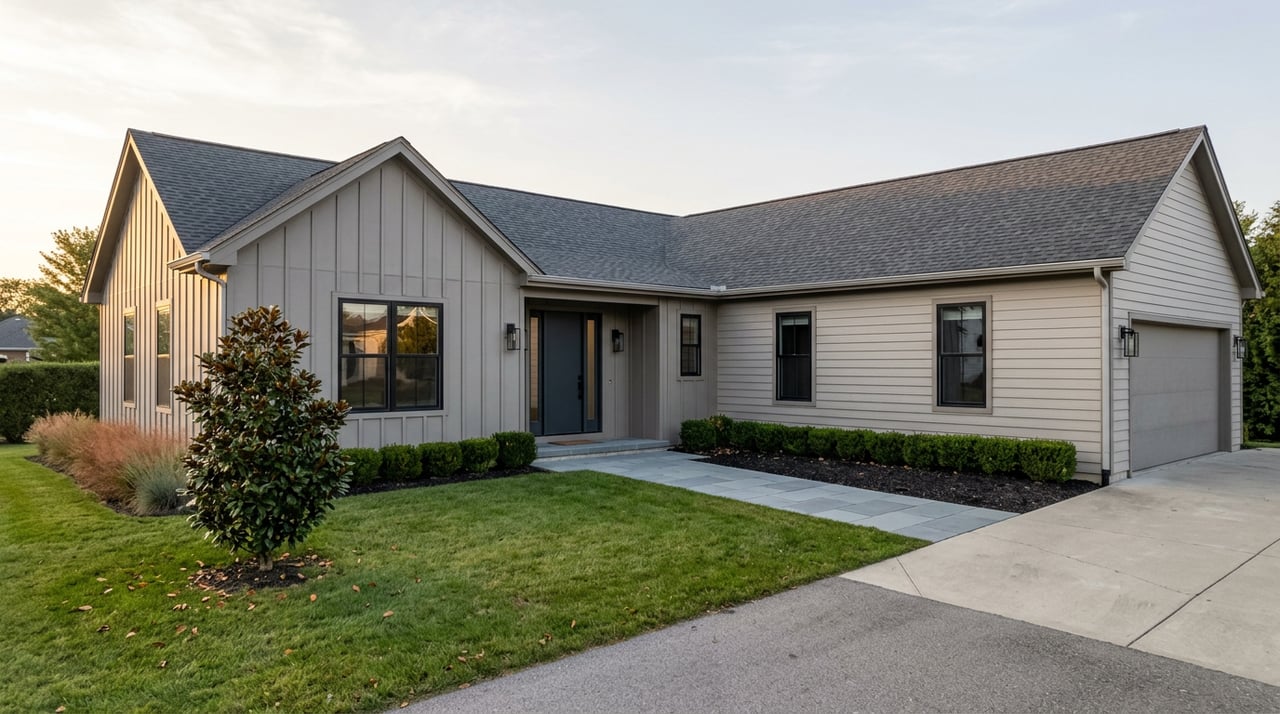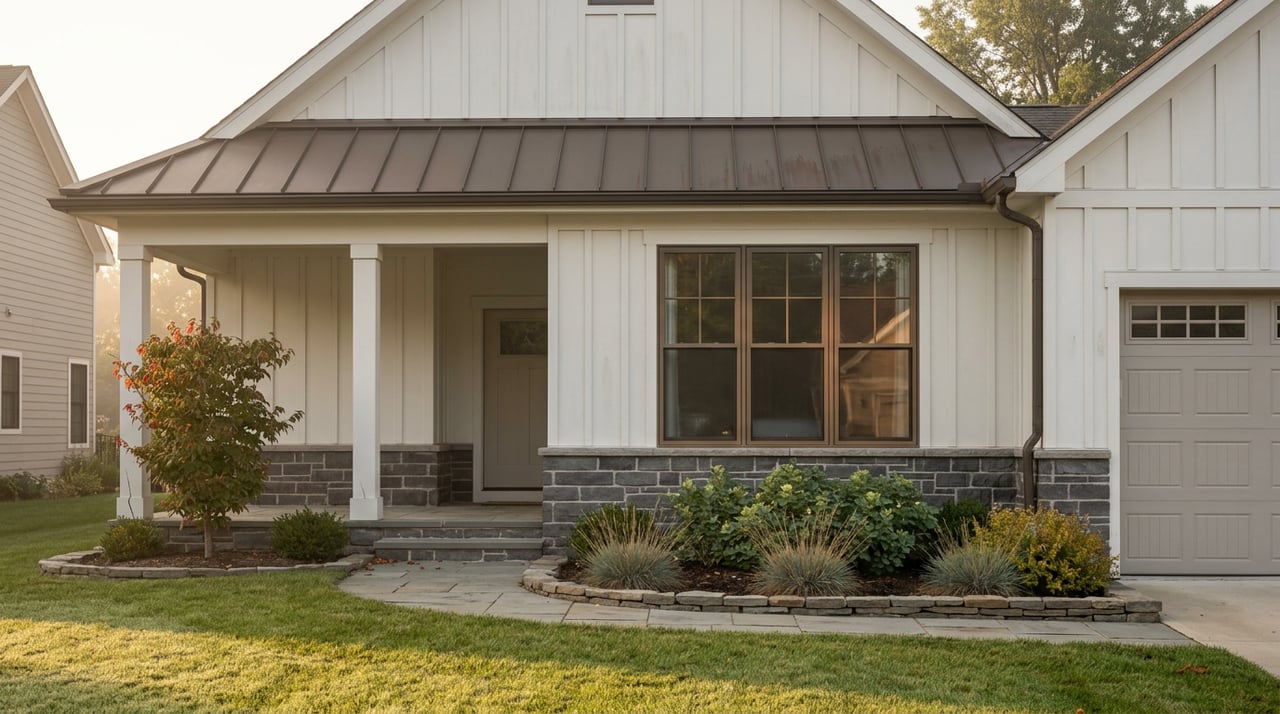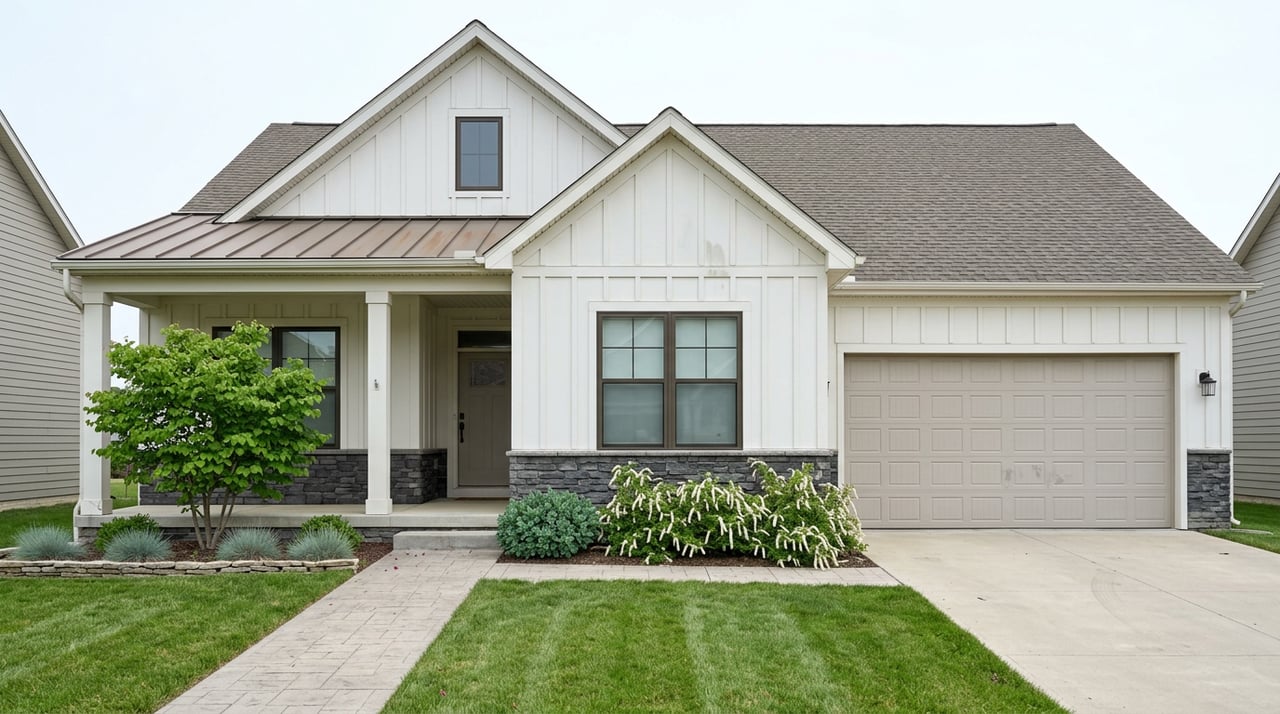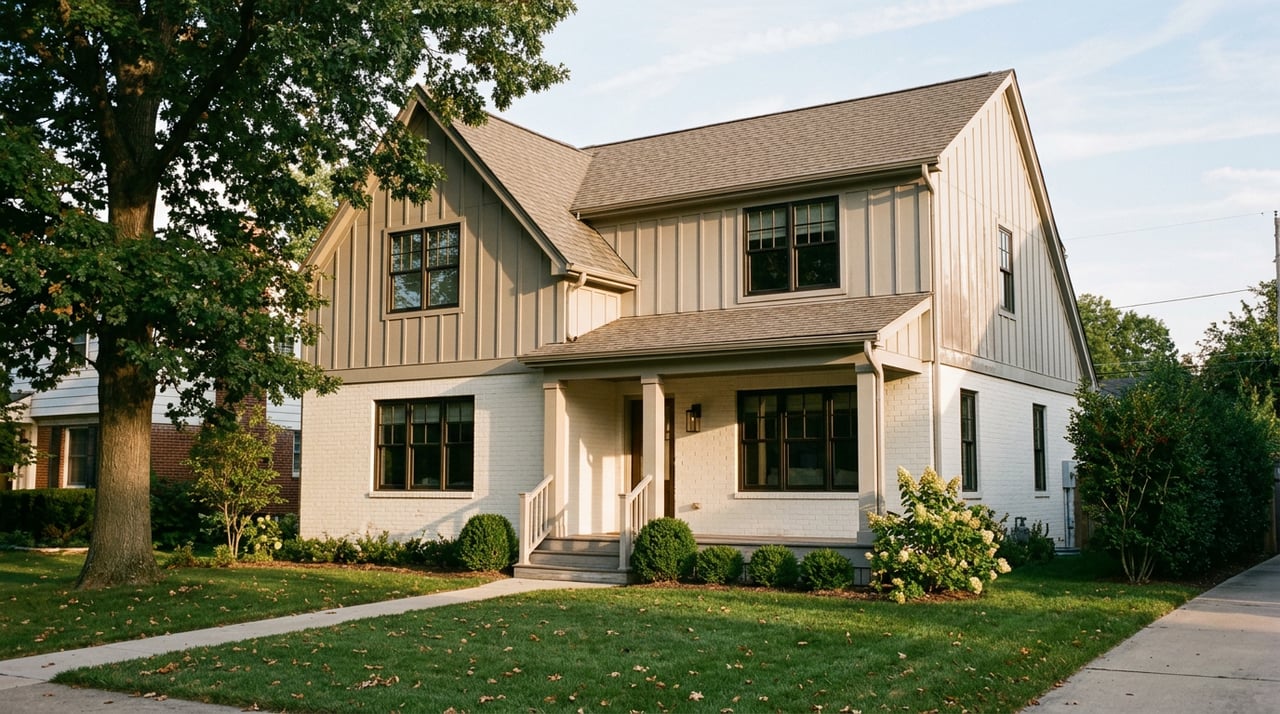
A $175,000 bungalow on the streets threading off Eastman Road and a $500,000 brick home on Rotherwood Drive sit inside the same city limits, the same school district, and a short drive of each other on the same ten-mile Greenbelt trail. And yet one buyer's budget covers roughly a third of what the other one needs.
That gap isn't a mistake in the data. It's the point.
The Number on the Portal Is Already an Average of Averages
Anyone shopping Kingsport right now has probably seen a median price somewhere between $293,000 and $315,000, depending on which portal they checked and which month it pulled. Redfin's data through March 2026 put the median sale price at $315,000, up 6.1% year over year, with homes selling at 97.3% of list price on average. That last number matters more than it looks: a sale-to-list ratio near 97% means buyers have some room to negotiate, but sellers aren't getting steamrolled either. It's a balanced market, not a bidding war.
Here's where it gets less tidy. Zillow's home value index, which estimates the value of every home in an area rather than just the ones that sold, put average values in two different Kingsport zip codes at $253,000 and $257,000 as of its May and June 2026 updates. That's not a contradiction so much as a reminder that "citywide median" already blends several very different pockets of the city before you've even looked at a single neighborhood name.
So the real question a buyer comparing neighborhoods should be asking isn't "what's Kingsport's median." It's "which Kingsport am I actually pricing."
The Line Kingsport Drew in 1917
To understand why the answer varies so much by street, you have to go back to how the city was built in the first place, because Kingsport wasn't assembled block by block over a century the way most Tennessee towns were. It was designed, on paper, in a single stretch of the 1910s.
When the town was re-chartered in 1917, the Kingsport Improvement Company, led by J. Fred Johnson and backed by railroad money from George L. Carter, hired John Nolen, a city planner out of Cambridge, Massachusetts, to lay out the whole thing from scratch. Nolen's plan put Church Circle at the center as the town square, sent residential streets radiating outward with sidewalks, parks, and trees in the style of the era's City Beautiful movement, and pushed industry down toward the river. The result earned Kingsport its lasting nickname: the Model City, one of the first professionally planned, privately financed cities built in twentieth-century America.
Nolen's map didn't stamp any neighborhood with a price tag. But geography did the sorting anyway. The high ground threading out from Church Circle and along the river bluffs became the city's established, larger-lot neighborhoods, the ones that eventually grew into Allandale and the adjoining historic Rotherwood area. Meanwhile, as Eastman's plant expanded through the 1940s and 1950s and the workforce needed somewhere close to live, modest single-story homes went up along Eastman Road itself, a neighborhood known today as Highland Park.
Nobody zoned one for executives and the other for line workers on a legal document. But a hundred years later, the price map still traces that original geography almost exactly.
What the Original Layout Still Costs You
The current spread across Kingsport's named neighborhoods looks like this, based on listings and neighborhood-level data from early 2026:
| Neighborhood | Typical Price Range | What You're Paying For |
|---|---|---|
| Highland Park | roughly $150,000 to $250,000 | Walkable, close to downtown and Dobyns-Bennett High School, older single-story housing stock |
| Borden Village | median near $199,900 | Modest, close-in, similar era to Highland Park |
| Ridgefields | roughly $180,000 to $320,000 | Established mid-century homes, still inside city school boundaries |
| Green Acres | median near $295,000 | Mid-range, centrally located |
| Preston Forest, Preston Woods, Crown Colony | roughly $280,000 to $450,000 | Newer construction from the 1990s through the 2020s, larger lots, some golf course access |
| Allandale and Rotherwood | roughly $250,000 to $500,000-plus | Large lots, tree-lined streets, proximity to Bays Mountain Park |
| Downtown Kingsport | median near $425,000 | The most revitalized, most walkable core, closest to Broad Street's restaurants and the Kingsport Carousel |
Look at that table long enough and the shape of Nolen's original plan is still visible in it. The neighborhoods built on or near the high ground he laid out in 1917 sit at the top of the range. The neighborhood that grew up alongside the plant sits at the bottom. Everything else fills in the middle depending on when it was built and how far it sits from either anchor.
The Renovation Math the Sticker Price Doesn't Show
Here's the part that actually matters if you're the one holding a checkbook. A low number in Highland Park doesn't automatically mean a low total cost.
Homes needing renovation in Highland Park generally sell in the $40,000 to $100,000 range, while move-in ready houses in the same neighborhood run from the low $100,000s up to about $200,000. That's a real gap, and it's not cosmetic. Most of the housing stock there went up in the 1950s, which means a buyer chasing the lowest number on the map is often also signing up for a roof, wiring, or plumbing project before the first mortgage payment comes due. A $70,000 fixer that needs $60,000 of work isn't cheaper than a move-in ready $280,000 home in Ridgefields. It's a different kind of purchase entirely, one that trades a lower entry price for sweat equity and renovation risk.
This is the actual decision hiding inside every Kingsport neighborhood comparison. It's not just "what can I afford." It's "what condition am I buying, and does the neighborhood's price reflect that condition or just its address."
How to Use This If You're Comparing Neighborhoods
A few questions worth asking before you anchor to any single number:
- What decade was the home built, and does that match what the neighborhood's price range would suggest?
- Is the listed price for a renovated home or one that still needs work, and which range does this specific property actually fall into?
- How far is the commute to Eastman Chemical, BAE Systems, or wherever the job actually is, since Kingsport's neighborhoods were built around exactly that question a century ago?
- Does the lot size and setback match the era the neighborhood was built in, since newer subdivisions like Preston Forest trade smaller in-town lots for larger suburban ones?
None of these questions have a universal right answer. They're just the variables Nolen's original plan baked into the map before any of today's buyers showed up.
The Bottom Line
Kingsport's median home price isn't wrong. It's just doing the work of averaging together a neighborhood built for a plant's workforce in the 1940s and a neighborhood built on the high ground a planner from Massachusetts mapped out in 1917. Both are still Kingsport. Both are still a short drive from downtown and the Greenbelt. But they're not the same market, and treating the citywide number as a stand-in for either one is how buyers end up surprised, either by a renovation bill they didn't budget for or by a price tag that seemed high until they saw the lot.
If you're trying to figure out which Kingsport actually fits your budget and your timeline, that's a conversation worth having with someone who knows these streets block by block, not just by median. Mary Glenn Lively has spent nearly two decades working this market and can walk you through what a specific price range actually buys in a specific neighborhood. Get your home's free valuation and schedule a no-obligation consult to start figuring out where your number fits on Kingsport's map.